Connect Zing Data to ClickHouse
Zing Data is a data exploration and visualization platform. Zing Data connects to ClickHouse using the JS driver provided by ClickHouse.How to connect
Gather your connection details.
To connect to ClickHouse with HTTP(S) you need this information:
The HOST and PORT: typically, the port is 8443 when using TLS or 8123 when not using TLS.
The DATABASE NAME: out of the box, there is a database named
default, use the name of the database that you want to connect to.The USERNAME and PASSWORD: out of the box, the username is
default. Use the username appropriate for your use case.
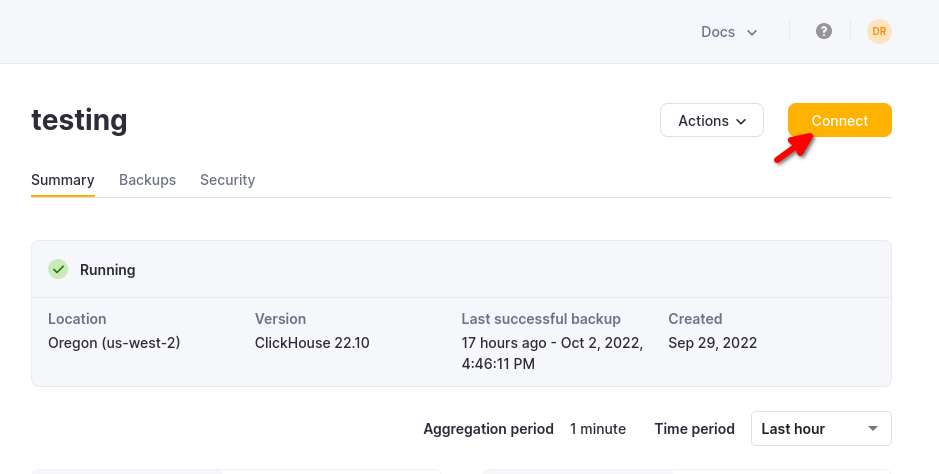
The details for your ClickHouse Cloud service are available in the ClickHouse Cloud console. Select the service that you will connect to and click Connect:
Choose HTTPS, and the details are available in an example
curlcommand.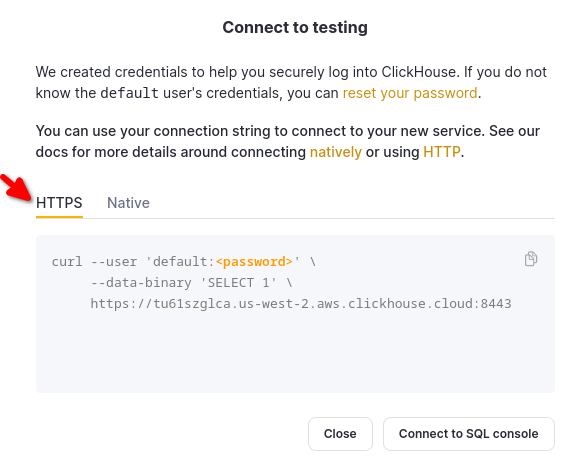
If you are using self-managed ClickHouse, the connection details are set by your ClickHouse administrator.
Download or visit Zing Data
To use Clickhouse with Zing Data on mobile, download the Zing data app on Google Play Store or the Apple App Store.
To use Clickhouse with Zing Data on the web, visit the Zing web console and create an account.
Add a datasource
To interact with your ClickHouse data with Zing Data, you need to define a datasource. On the mobile app menu in Zing Data, select Sources, then click on Add a Datasource.
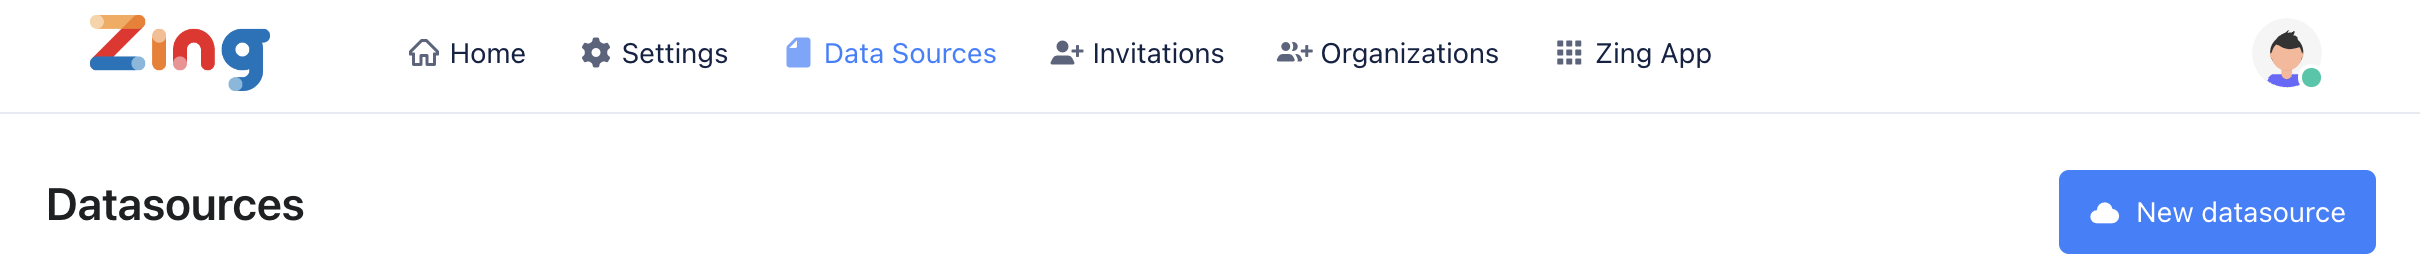
To add a datasource on web, click on Data Sources on the top menu, click on New Datasource and select Clickhouse from the dropdown menu
Fill out the connection details and click on Check Connection.
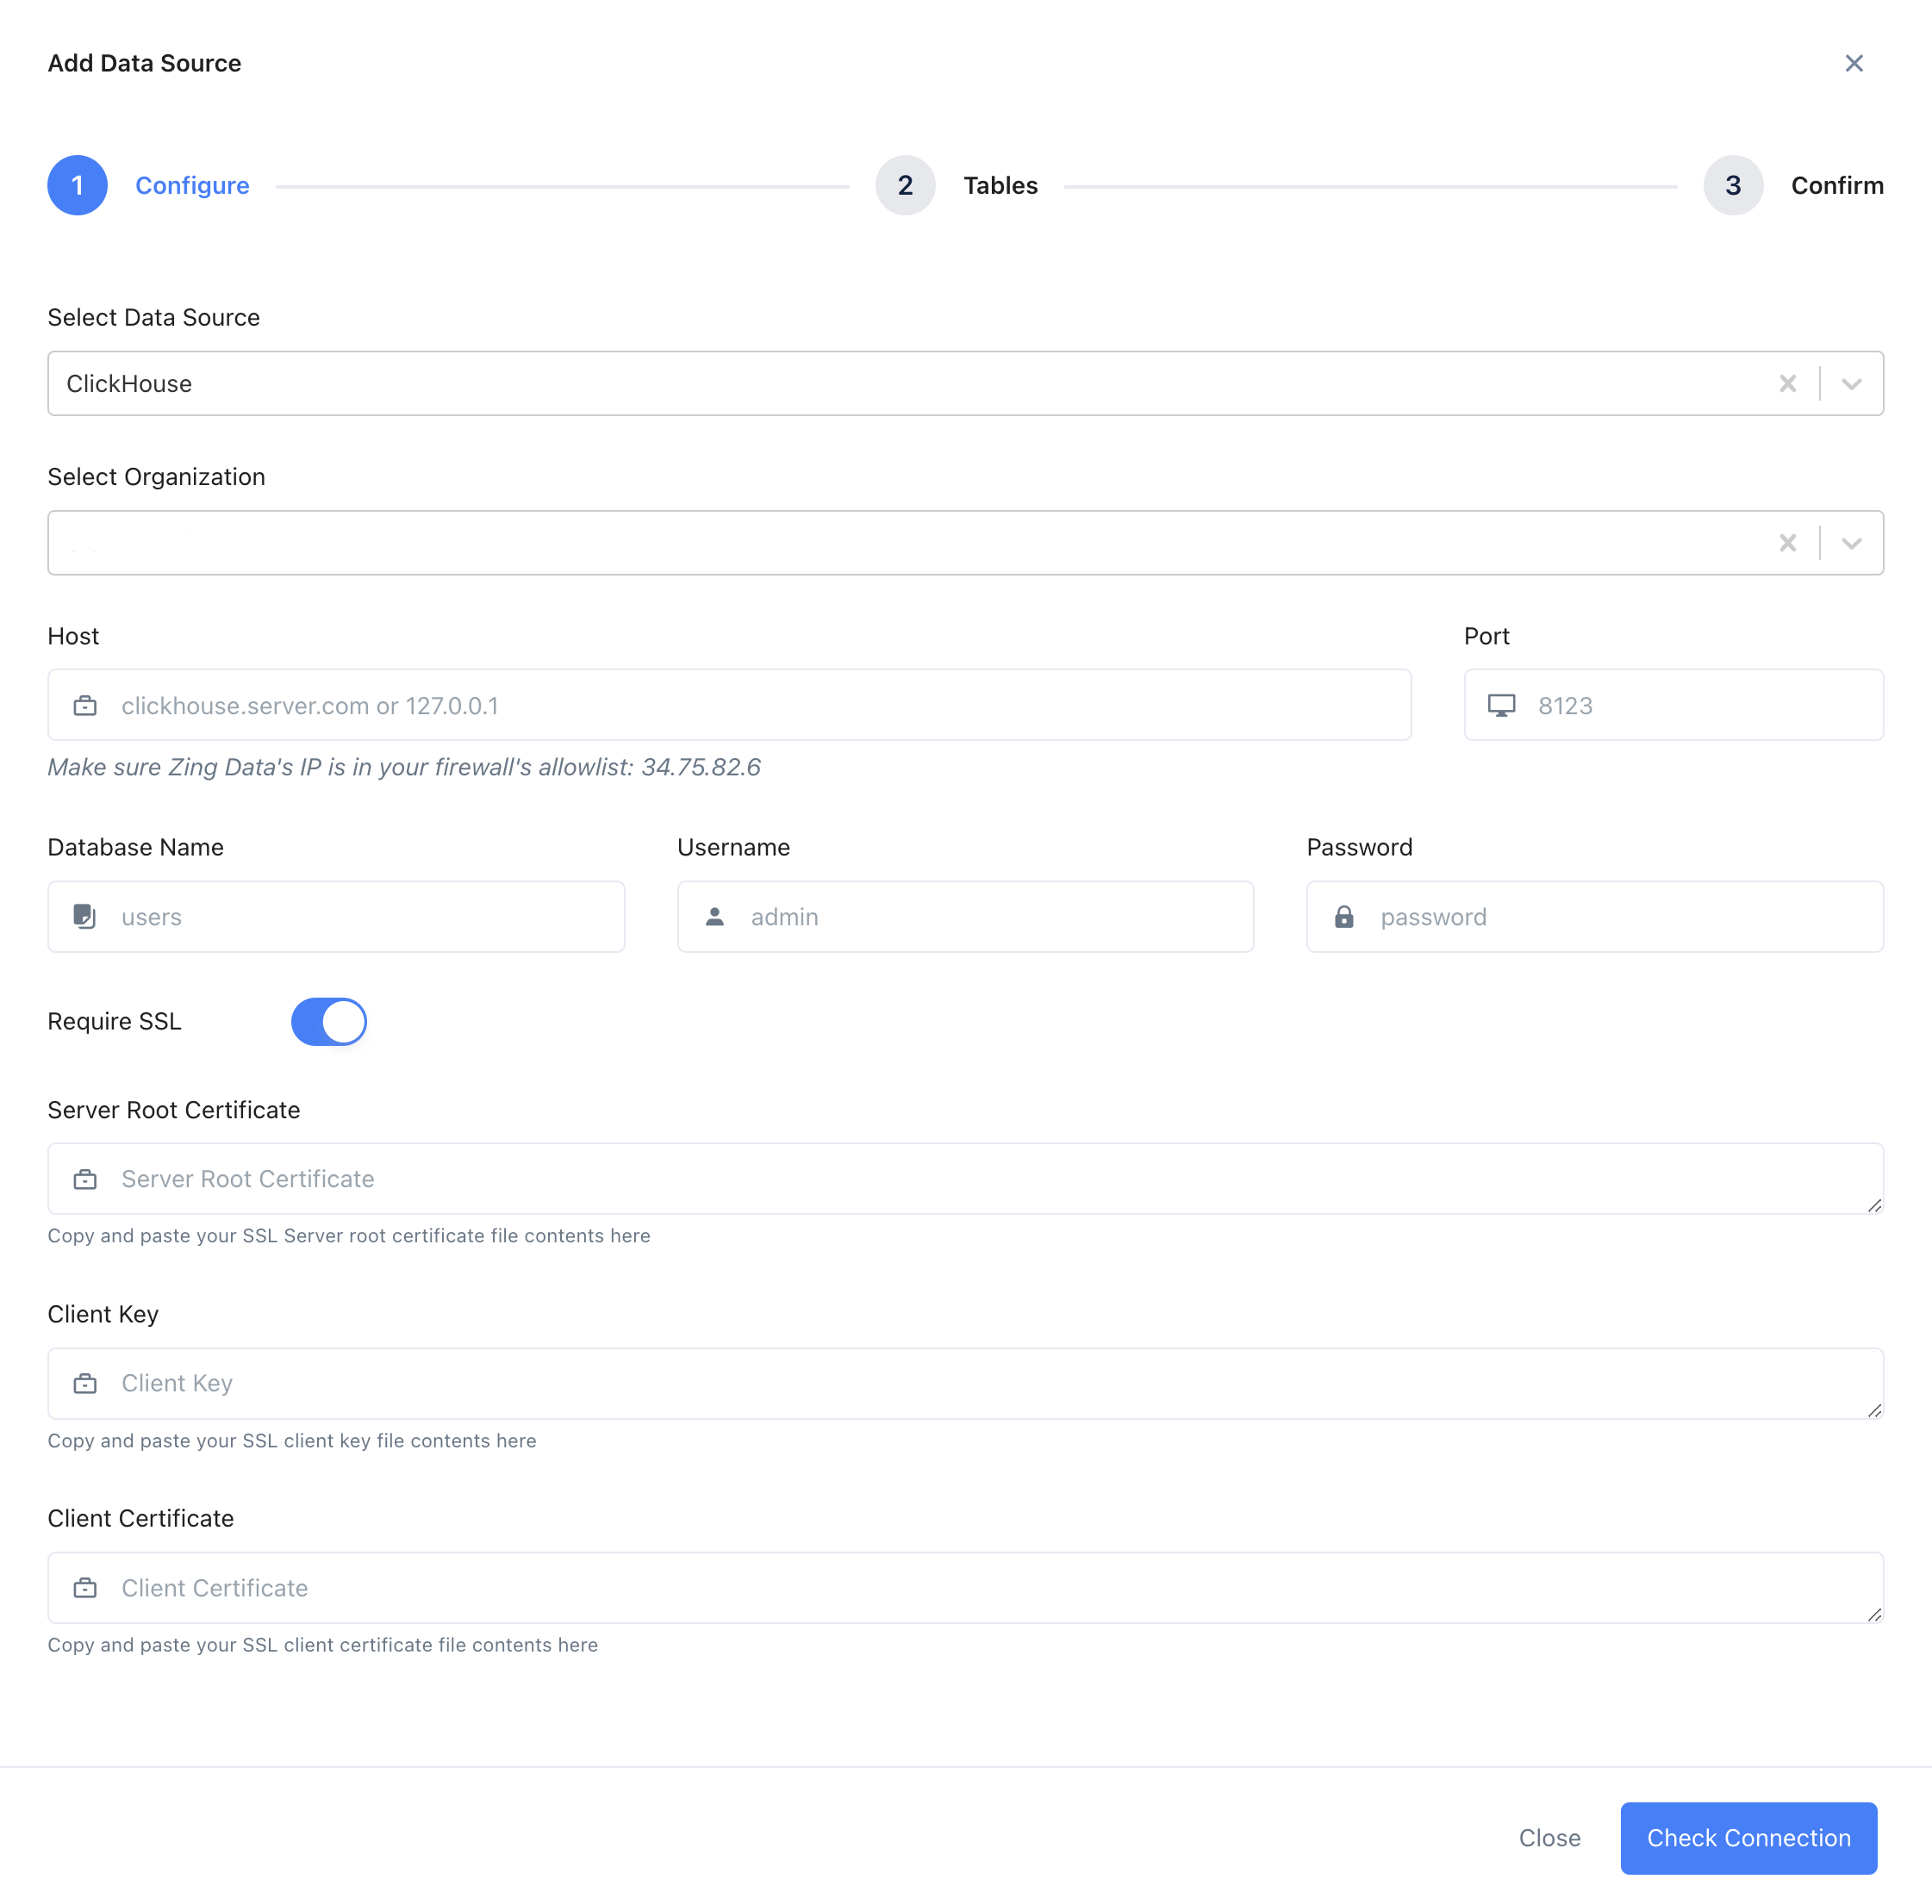
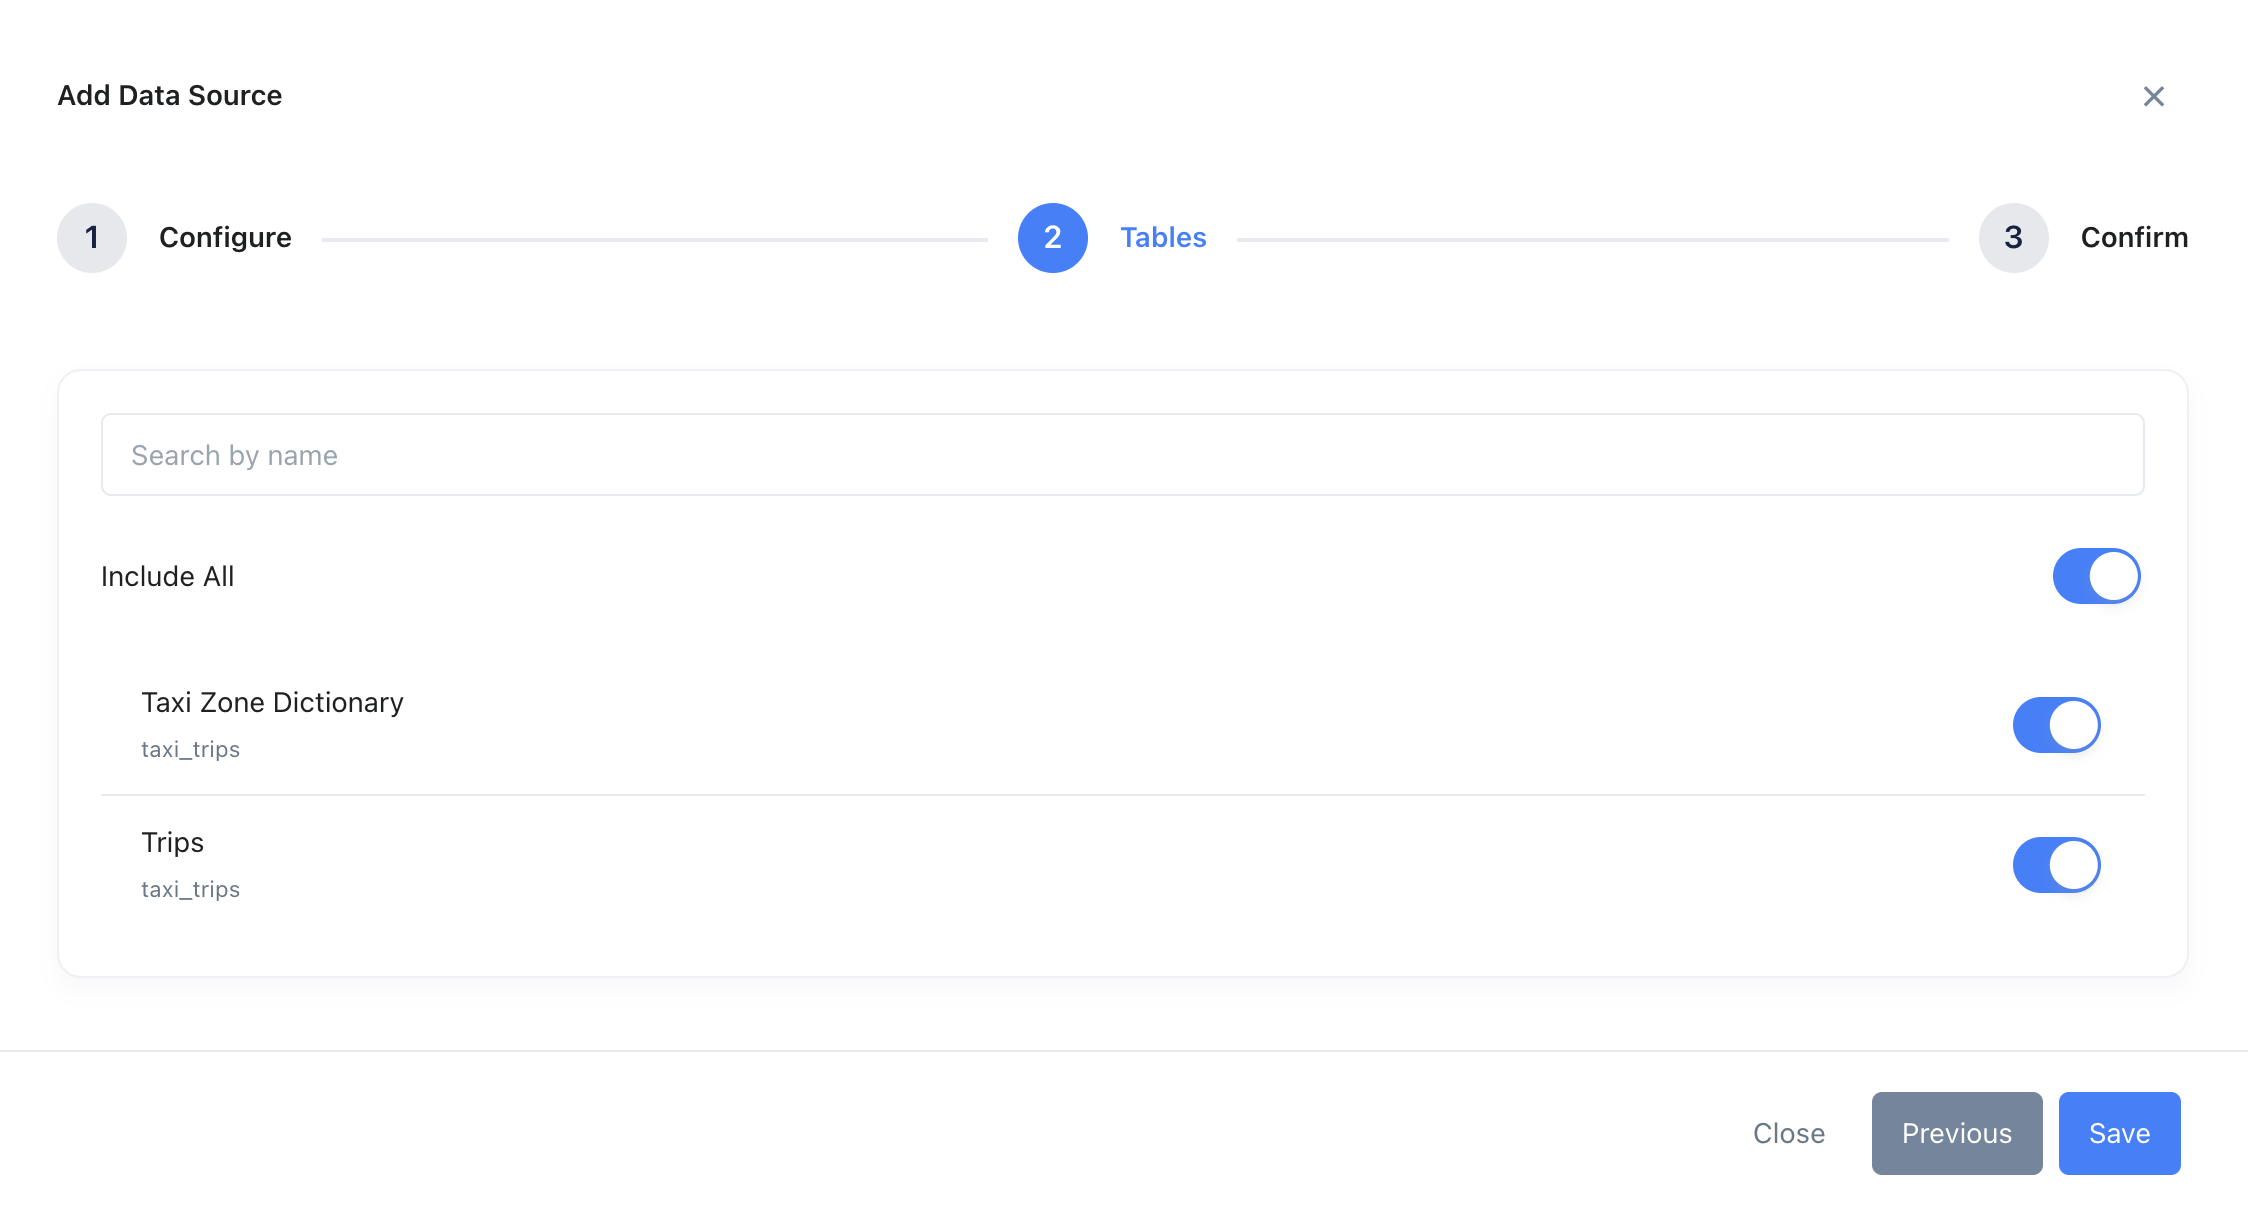
If the connection is successful, Zing will proceed you to table selection. Select the required tables and click on Save. If Zing cannot connect to your data source, you'll see a message asking your to check your credentials and retry. If even after checking your credentials and retrying you still experience issues, reach out to Zing support here.
Once the Clickhouse datasource is added, it will be available to everyone in your Zing organization, under the Data Sources / Sources tab.
Creating Charts and Dashboards in Zing Data
After your Clickhouse datasource is added, click on Zing App on the web, or click on the datasource on mobile to start creating charts.
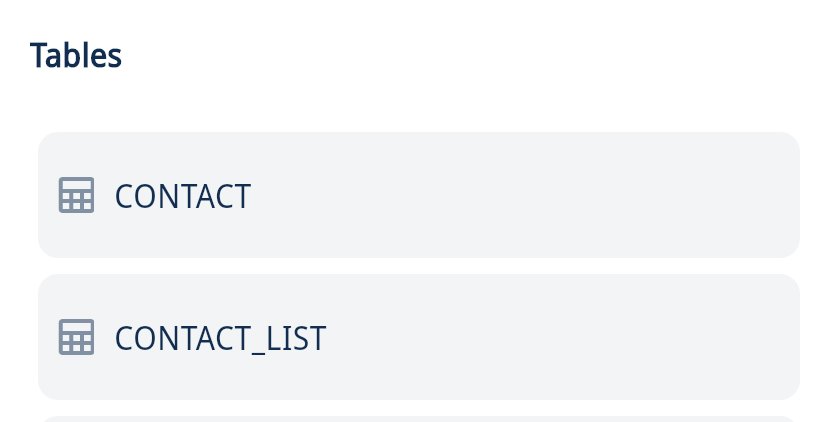
Click on a table under the table's list to create a chart.
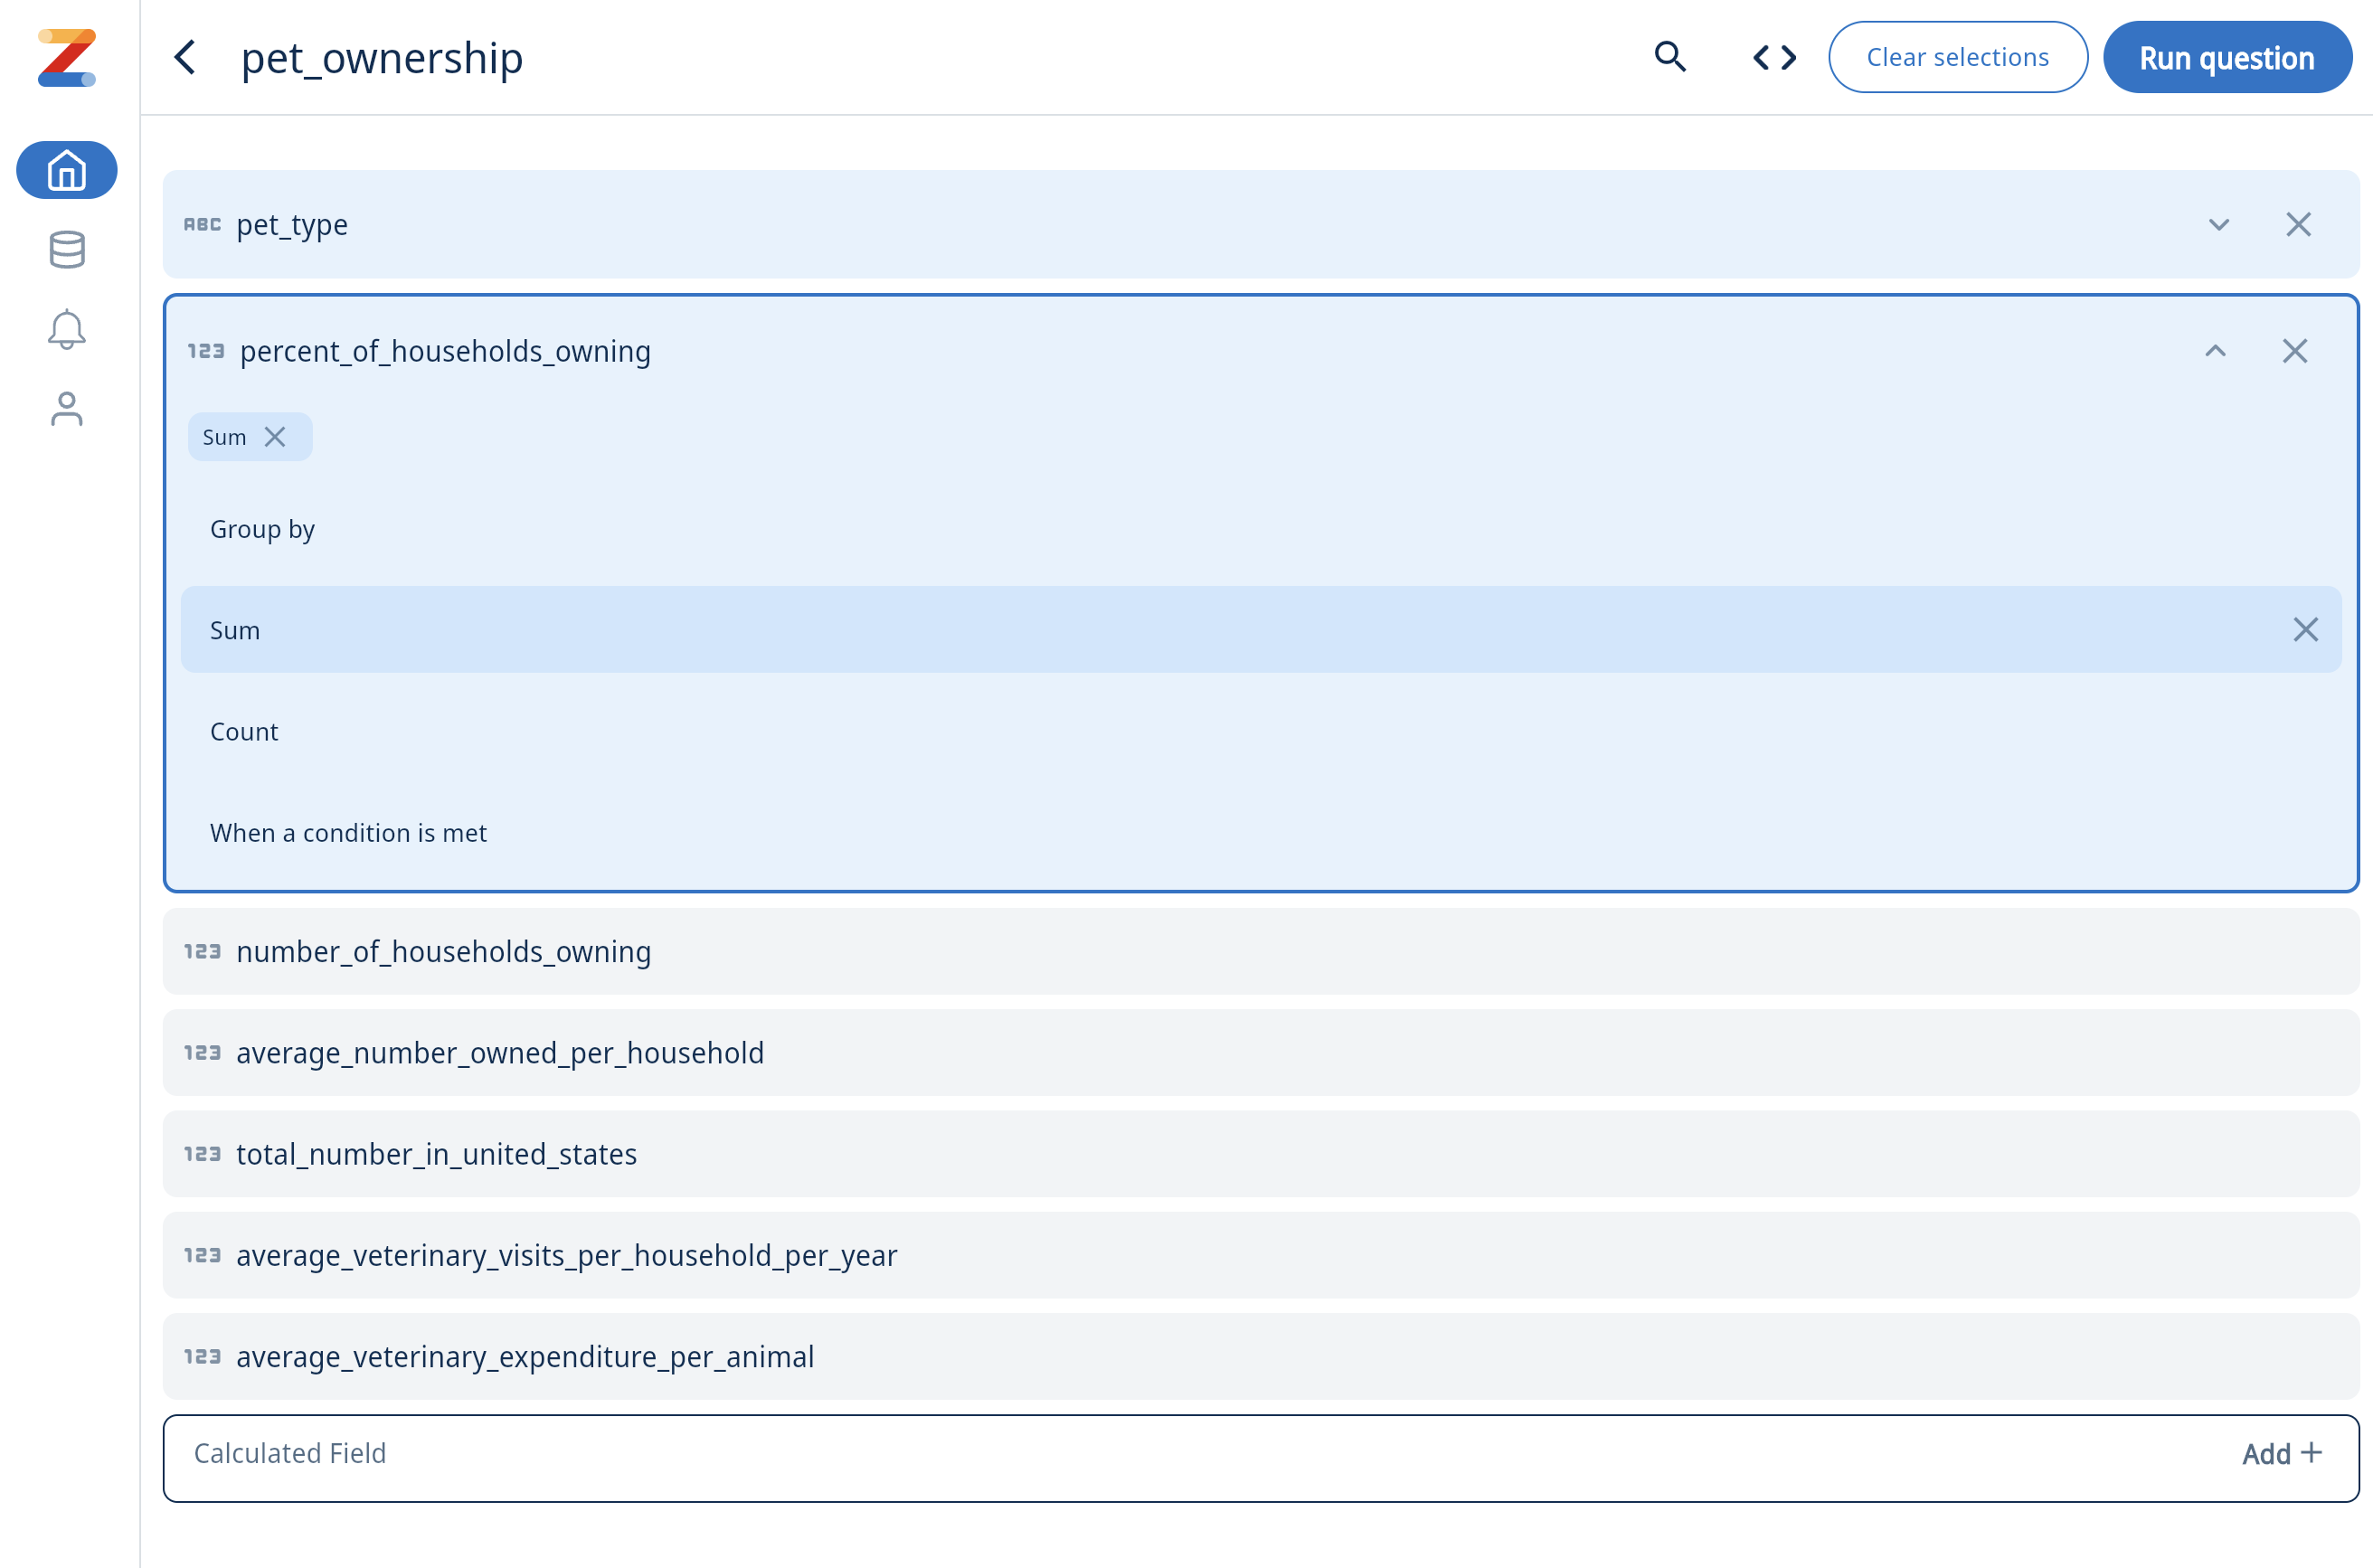
Use the visual query builder to pick the desired fields, aggregations, etc., and click on Run Question.
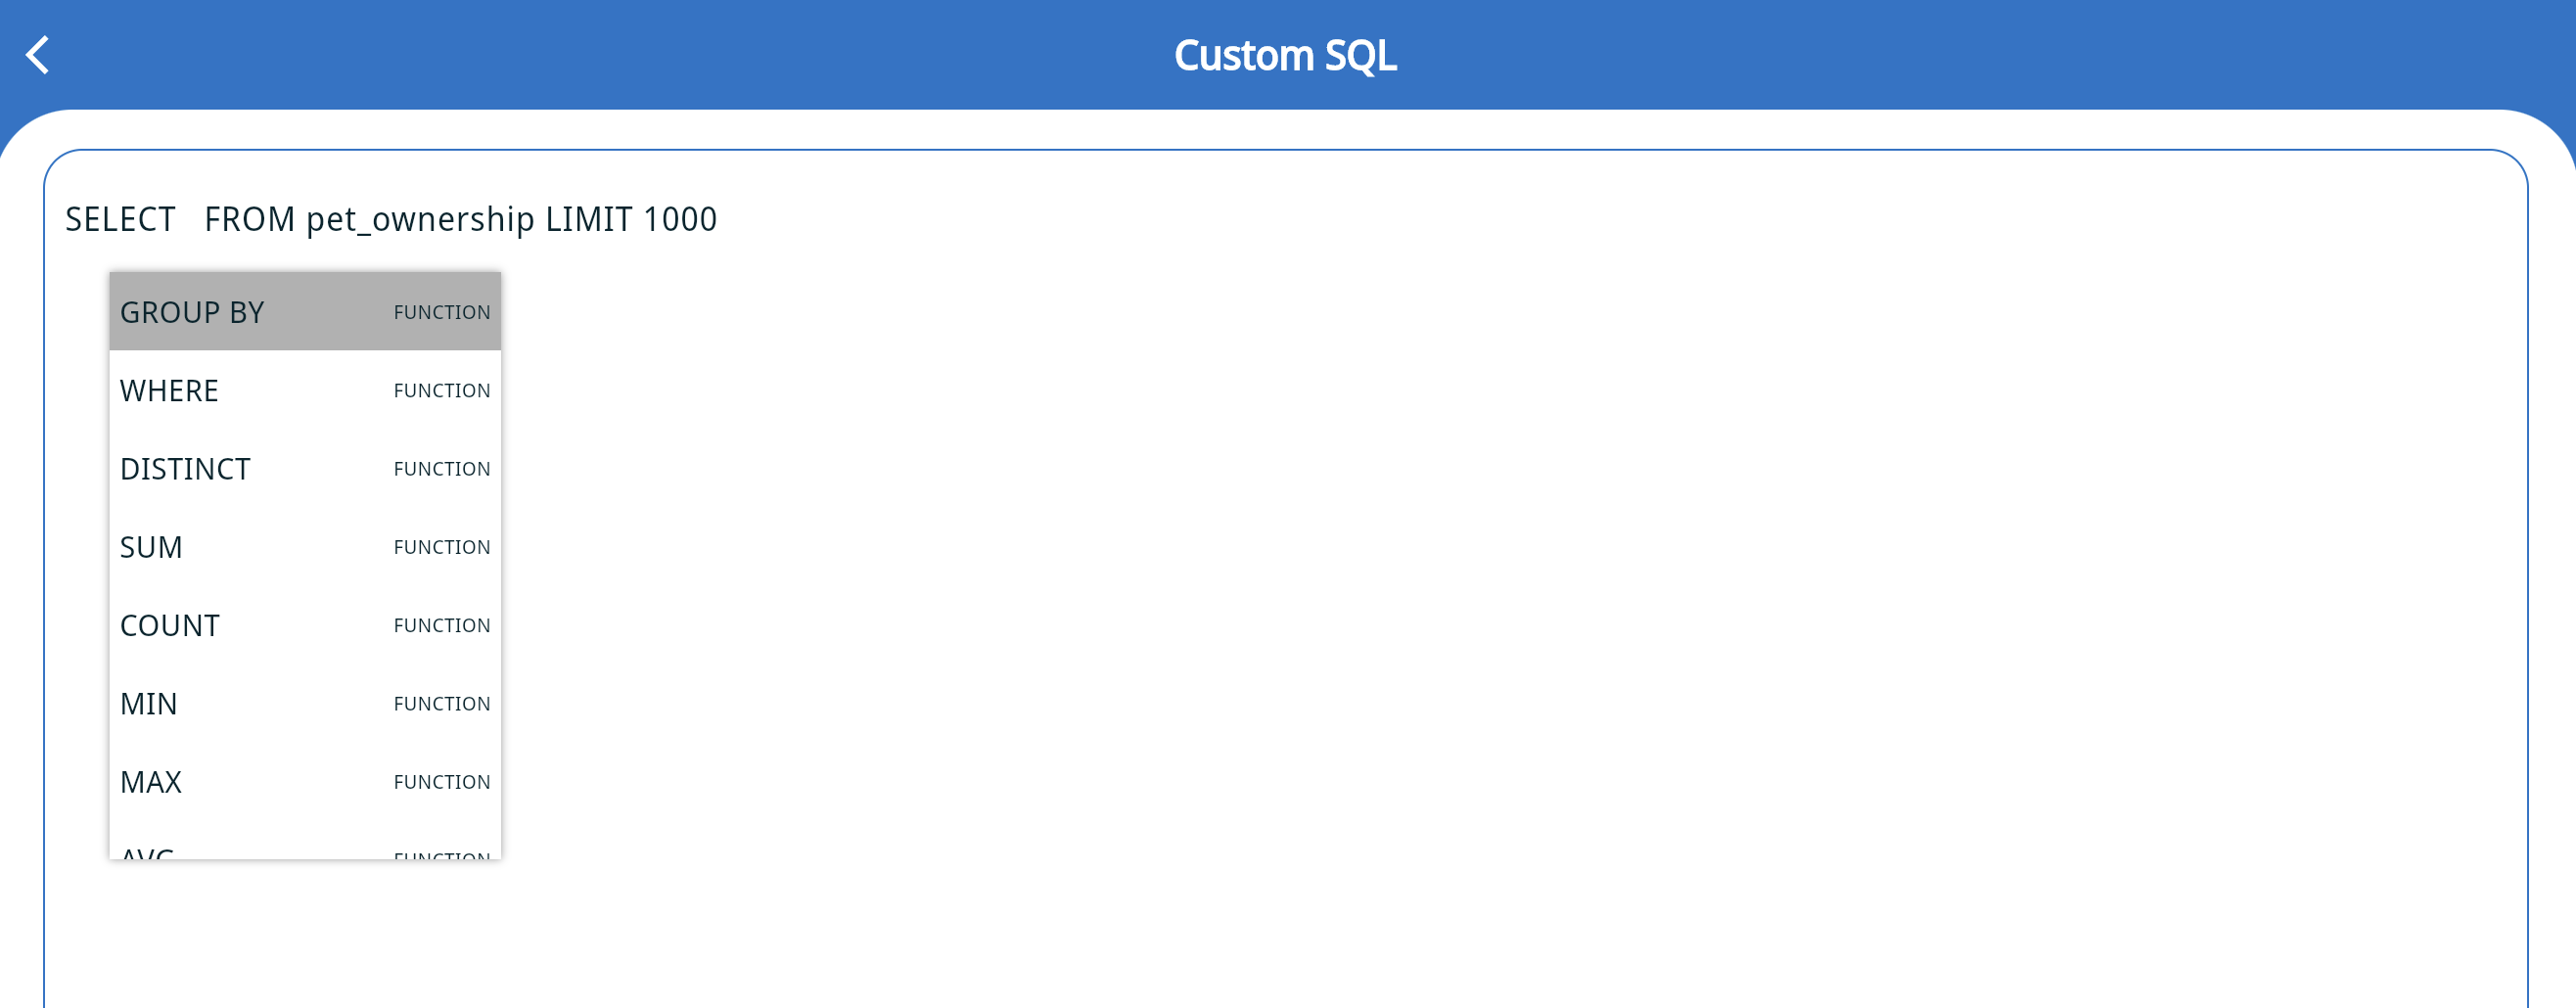
If you familiar with SQL, you can also write custom SQL to run queries and create a chart.

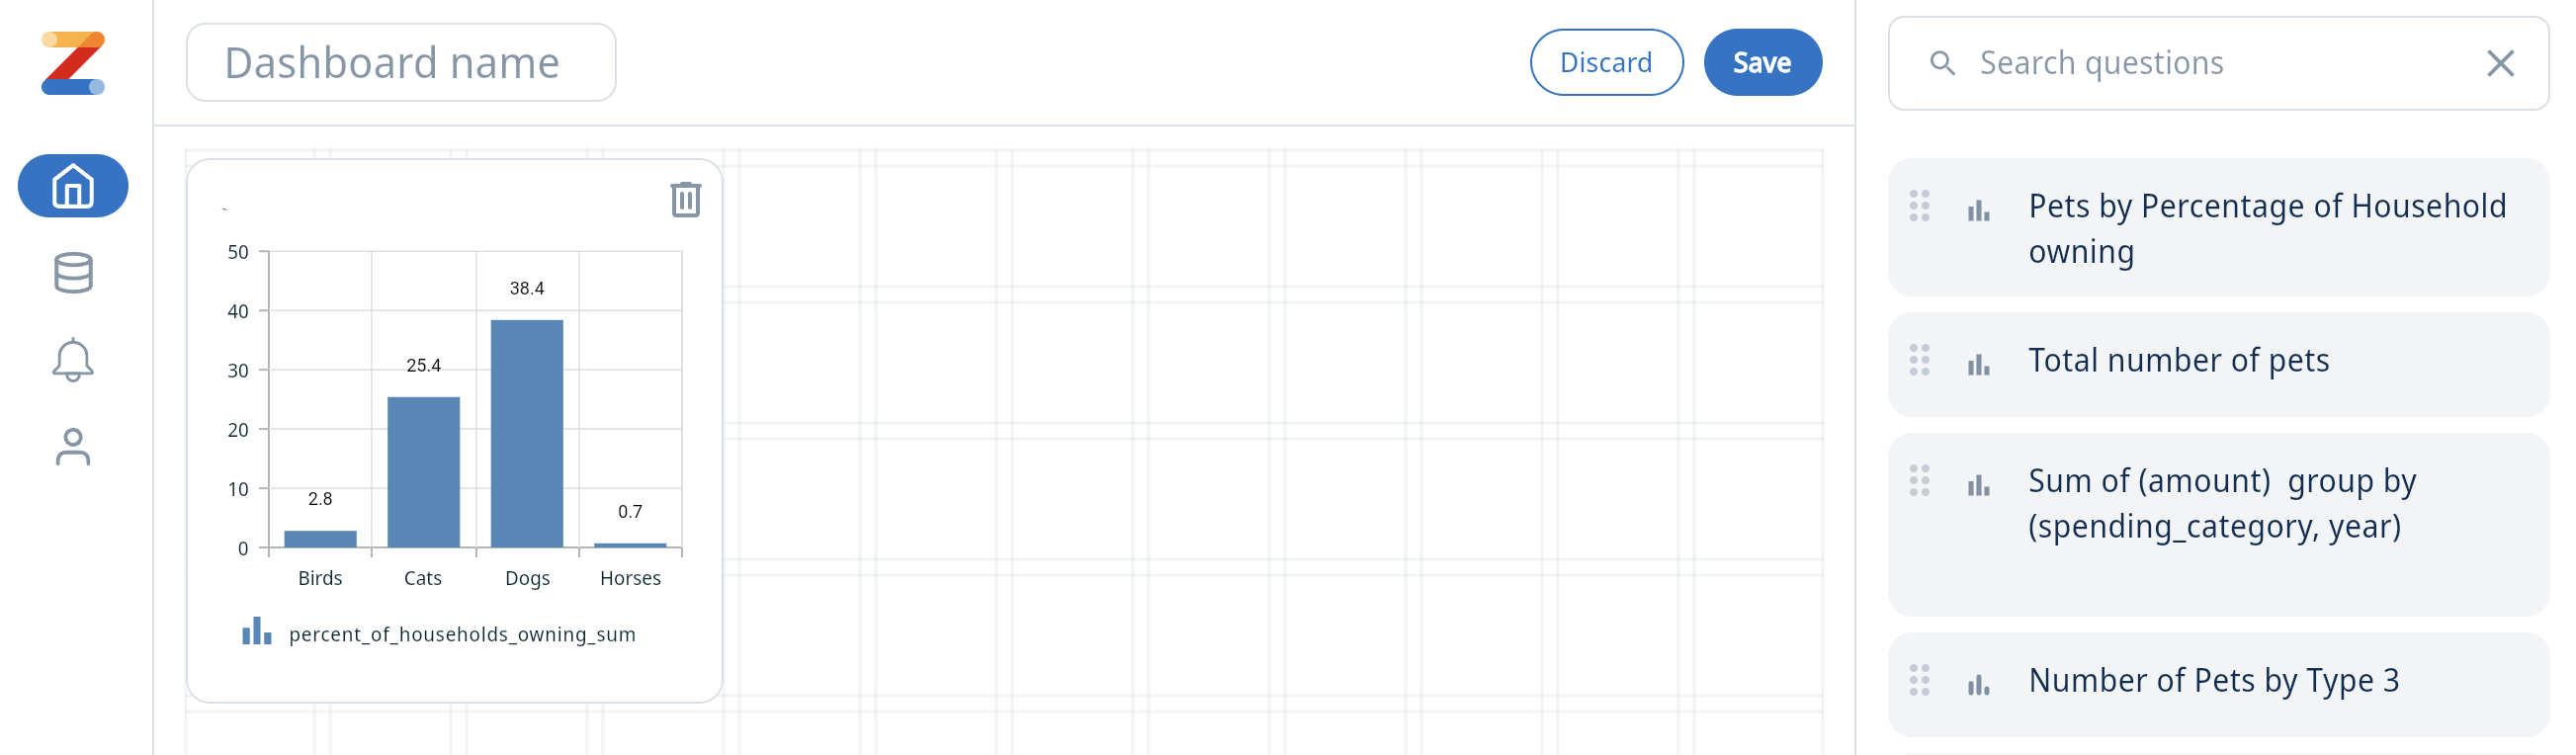
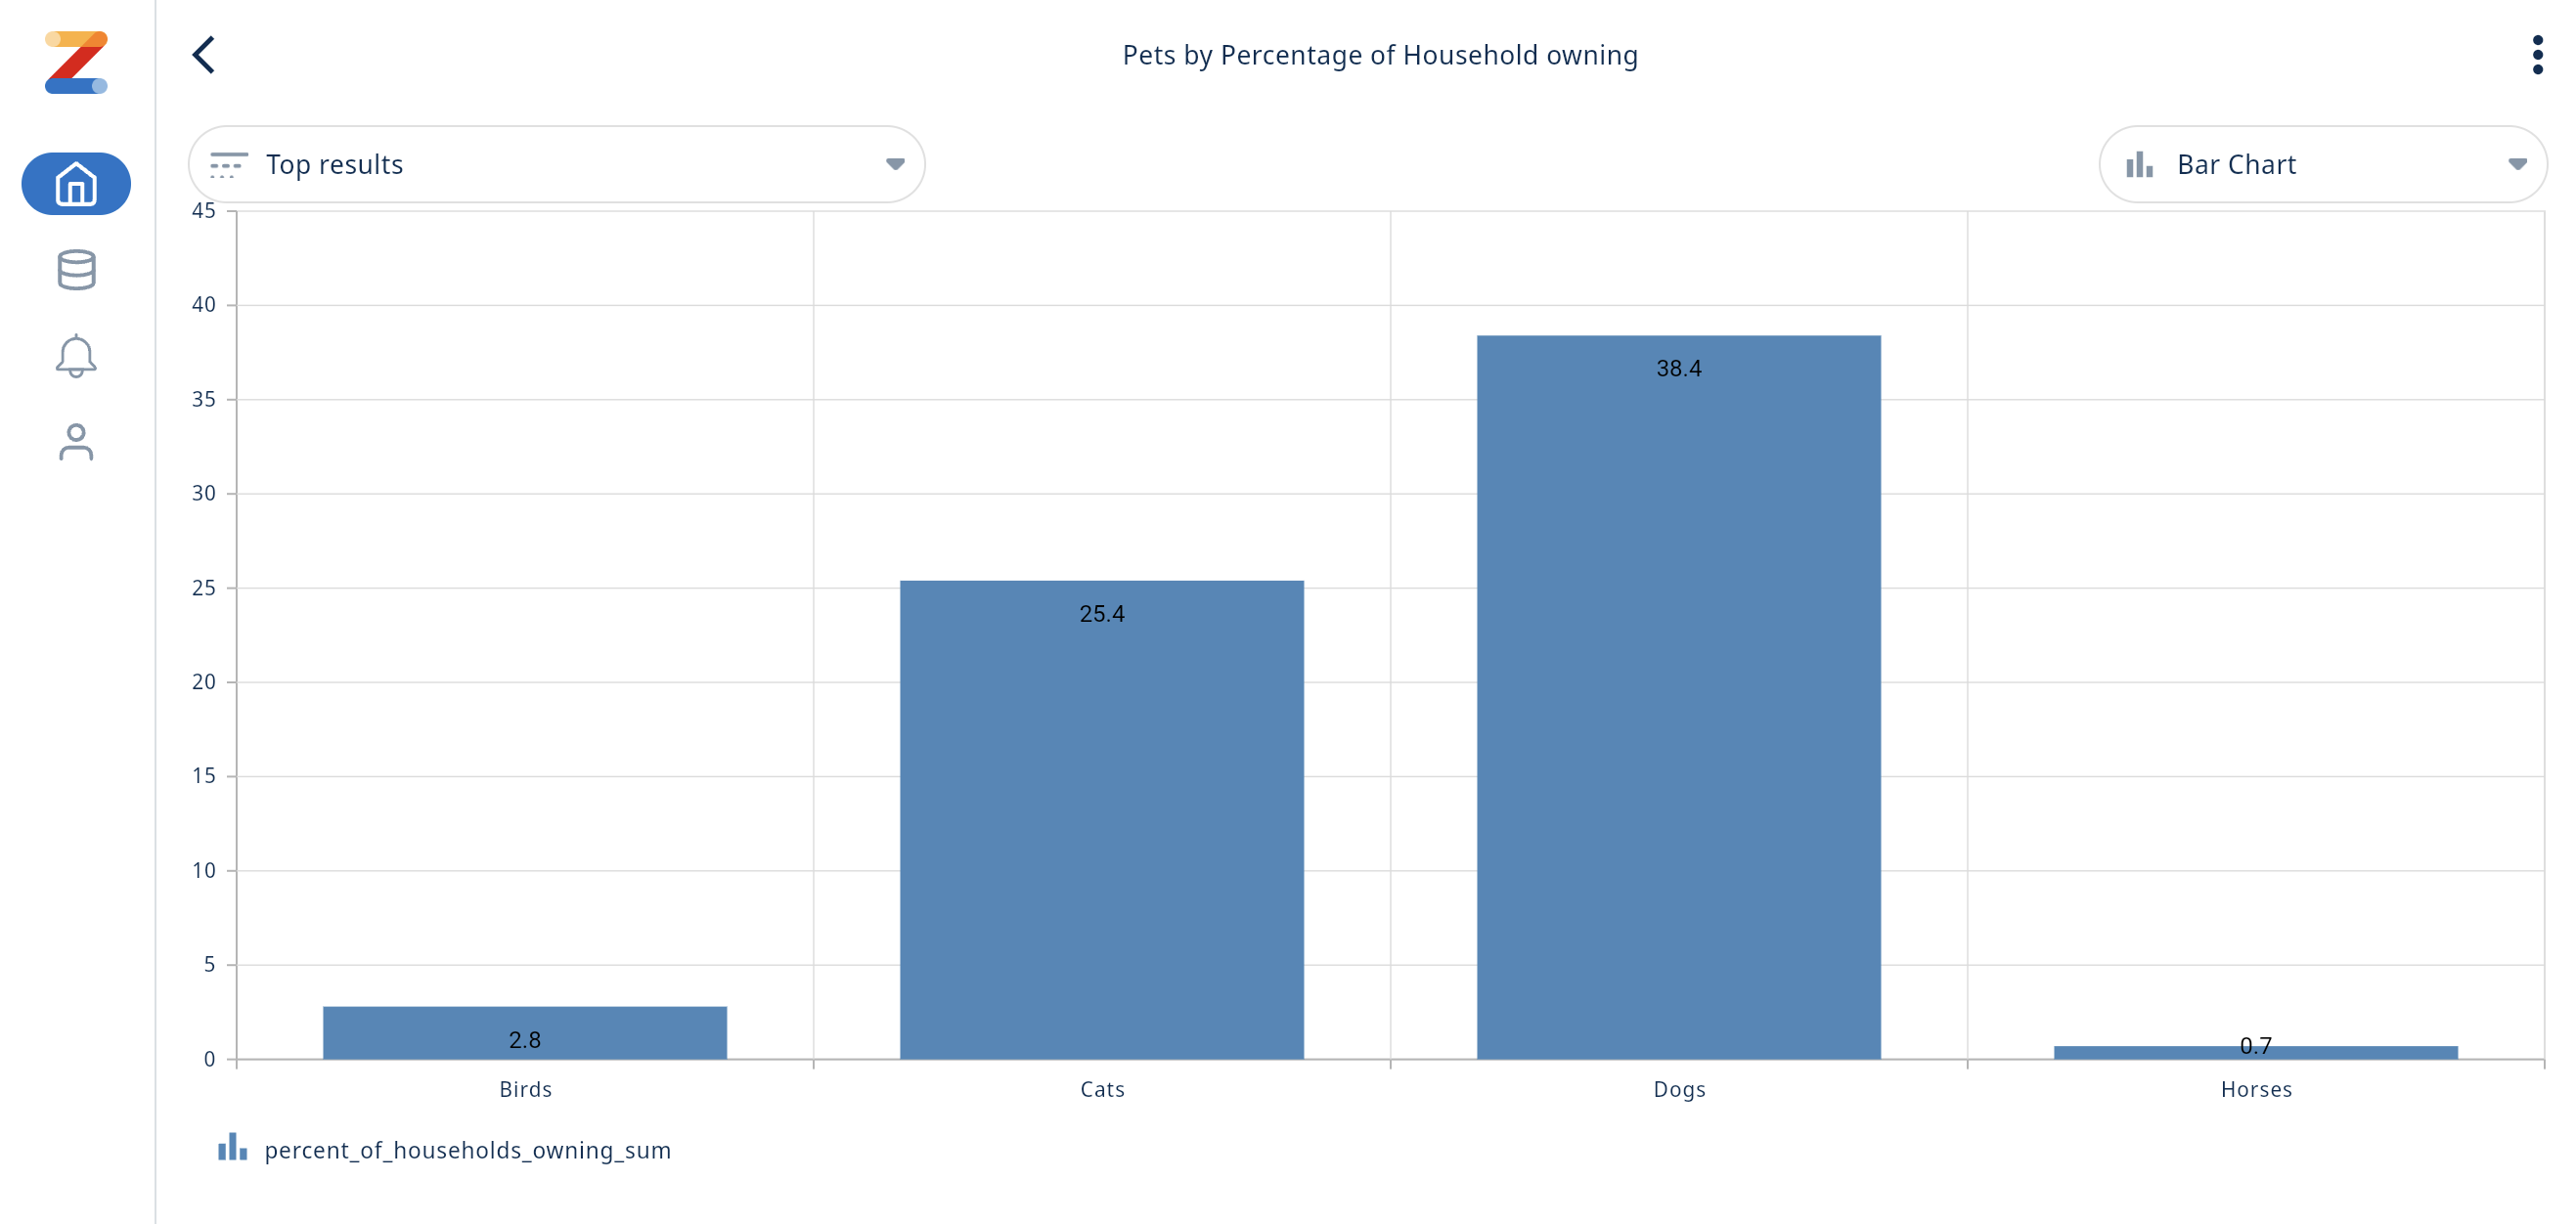
An example chart would look as follows. The question can be saved using the three-dot menu. You can comment on the chart, tag your team members, create real-time alerts, change the chart type, etc.
Dashboards can be created using the "+" icon under Dashboards on the Home screen. Existing questions can be dragged in, to be displayed on the dashboard.